
Introduction: What Is Transcriptomics and Why It Matters
Imagine if you could listen in on a cell’s internal conversation — every message it sends, every command it receives. That’s exactly what transcriptomics allows us to do. Transcriptomics is the study of the transcriptome, the complete set of RNA transcripts produced by the genome under specific conditions or in a specific cell type. It helps answer vital biological questions: Which genes are active? When? How much? And under what circumstances?
While genomics tells us what could happen, transcriptomics reveals what is actually happening in real time within a cell. This field is crucial for understanding disease mechanisms, developmental biology, responses to treatments, and evolutionary relationships.
Over the years, transcriptomic technologies have evolved rapidly, unlocking powerful ways to analyze gene expression — both broadly and in exquisite detail.
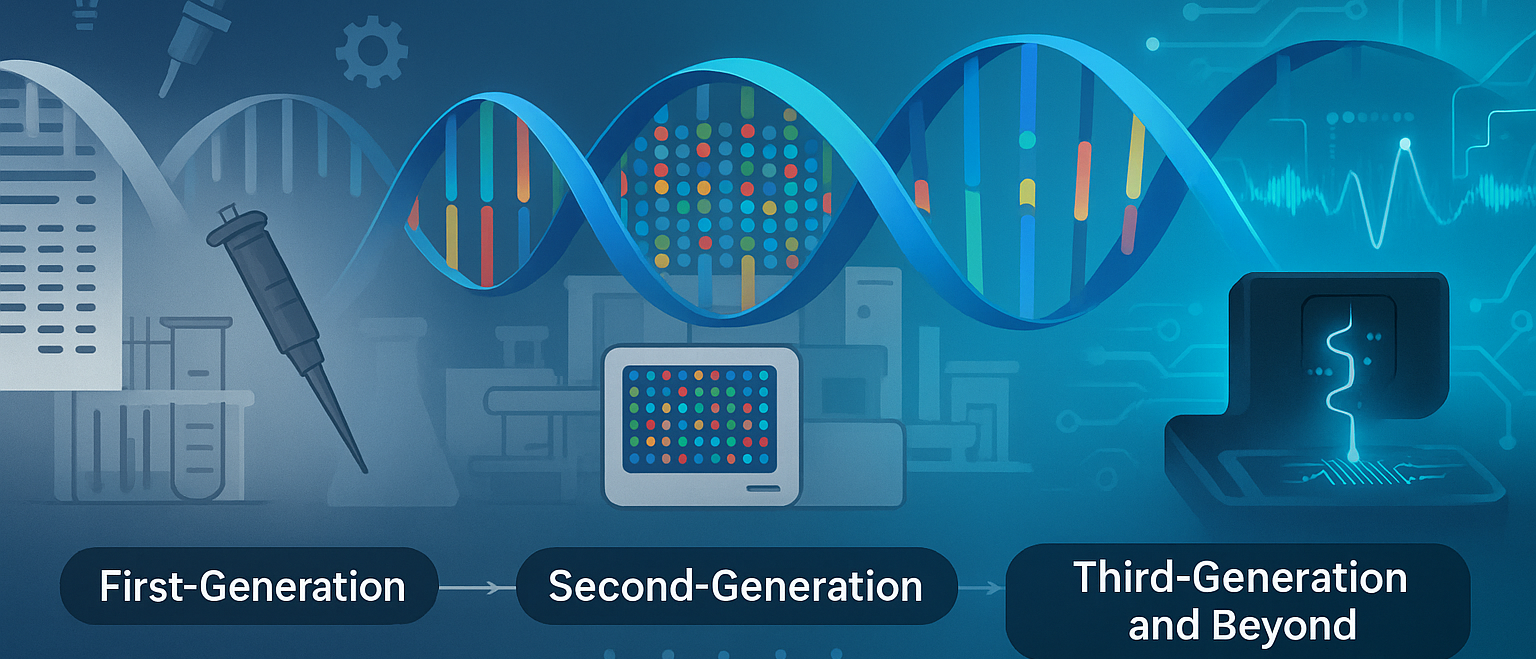
A Brief Timeline: Evolution of Transcriptomics
| Year | Milestone |
|---|---|
| 1995 | First use of microarray technology to measure gene expression (DeRisi et al., Science) |
| 2005 | Introduction of RNA-Seq, enabling whole-transcriptome analysis at nucleotide resolution |
| 2010s | Rise of single-cell RNA-Seq (scRNA-Seq) allowing expression profiling of individual cells |
| 2020s | Emergence of spatial transcriptomics, combining histology with RNA profiling |
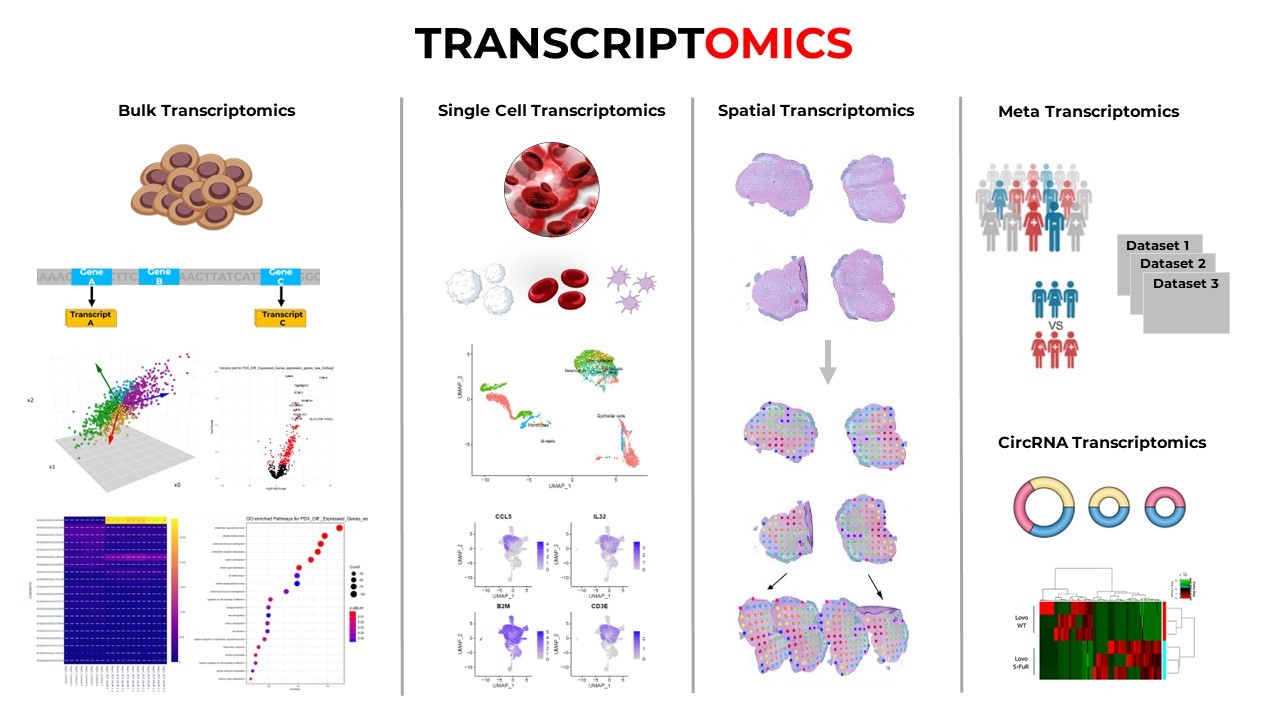
TYPES OF TRANSCRIPTOMICS STUDIES
The field of transcriptomics is incredibly diverse, offering a variety of approaches tailored to different biological questions. From analyzing gene expression in whole tissues to zooming in on single cells or mapping expression within the spatial architecture of tissues, each type of transcriptomic study provides unique insights. Let’s explore these major types of transcriptomic studies - how they work, what they reveal, and where they shine.
Bulk RNA-Seq: Capturing the Average Voice of a Cell Population
Bulk RNA sequencing, or bulk RNA-Seq, is the most traditional and widely used form of transcriptomic analysis. This method measures the average gene expression of a large group of cells, essentially creating a composite picture of transcriptional activity across a sample. The process begins by extracting total RNA from tissue or cultured cells, converting the RNA into complementary DNA (cDNA), sequencing the cDNA fragments, aligning the reads to a reference genome, and finally quantifying transcript levels.
Bulk RNA-Seq is ideal for comparing two or more biological conditions - for instance, tumor vs. normal tissues, treated vs. untreated cells, or diseased vs. healthy individuals. Its power lies in its ability to detect differentially expressed genes (DEGs), identify potential biomarkers, and perform functional enrichment analyses to understand affected biological pathways. One notable example of its application comes from a study on unexplained female infertility (GSE92324), where researchers used bulk RNA-Seq to analyze endometrial tissue samples and discovered distinct gene expression patterns linked to hormonal imbalance and disrupted implantation processes.
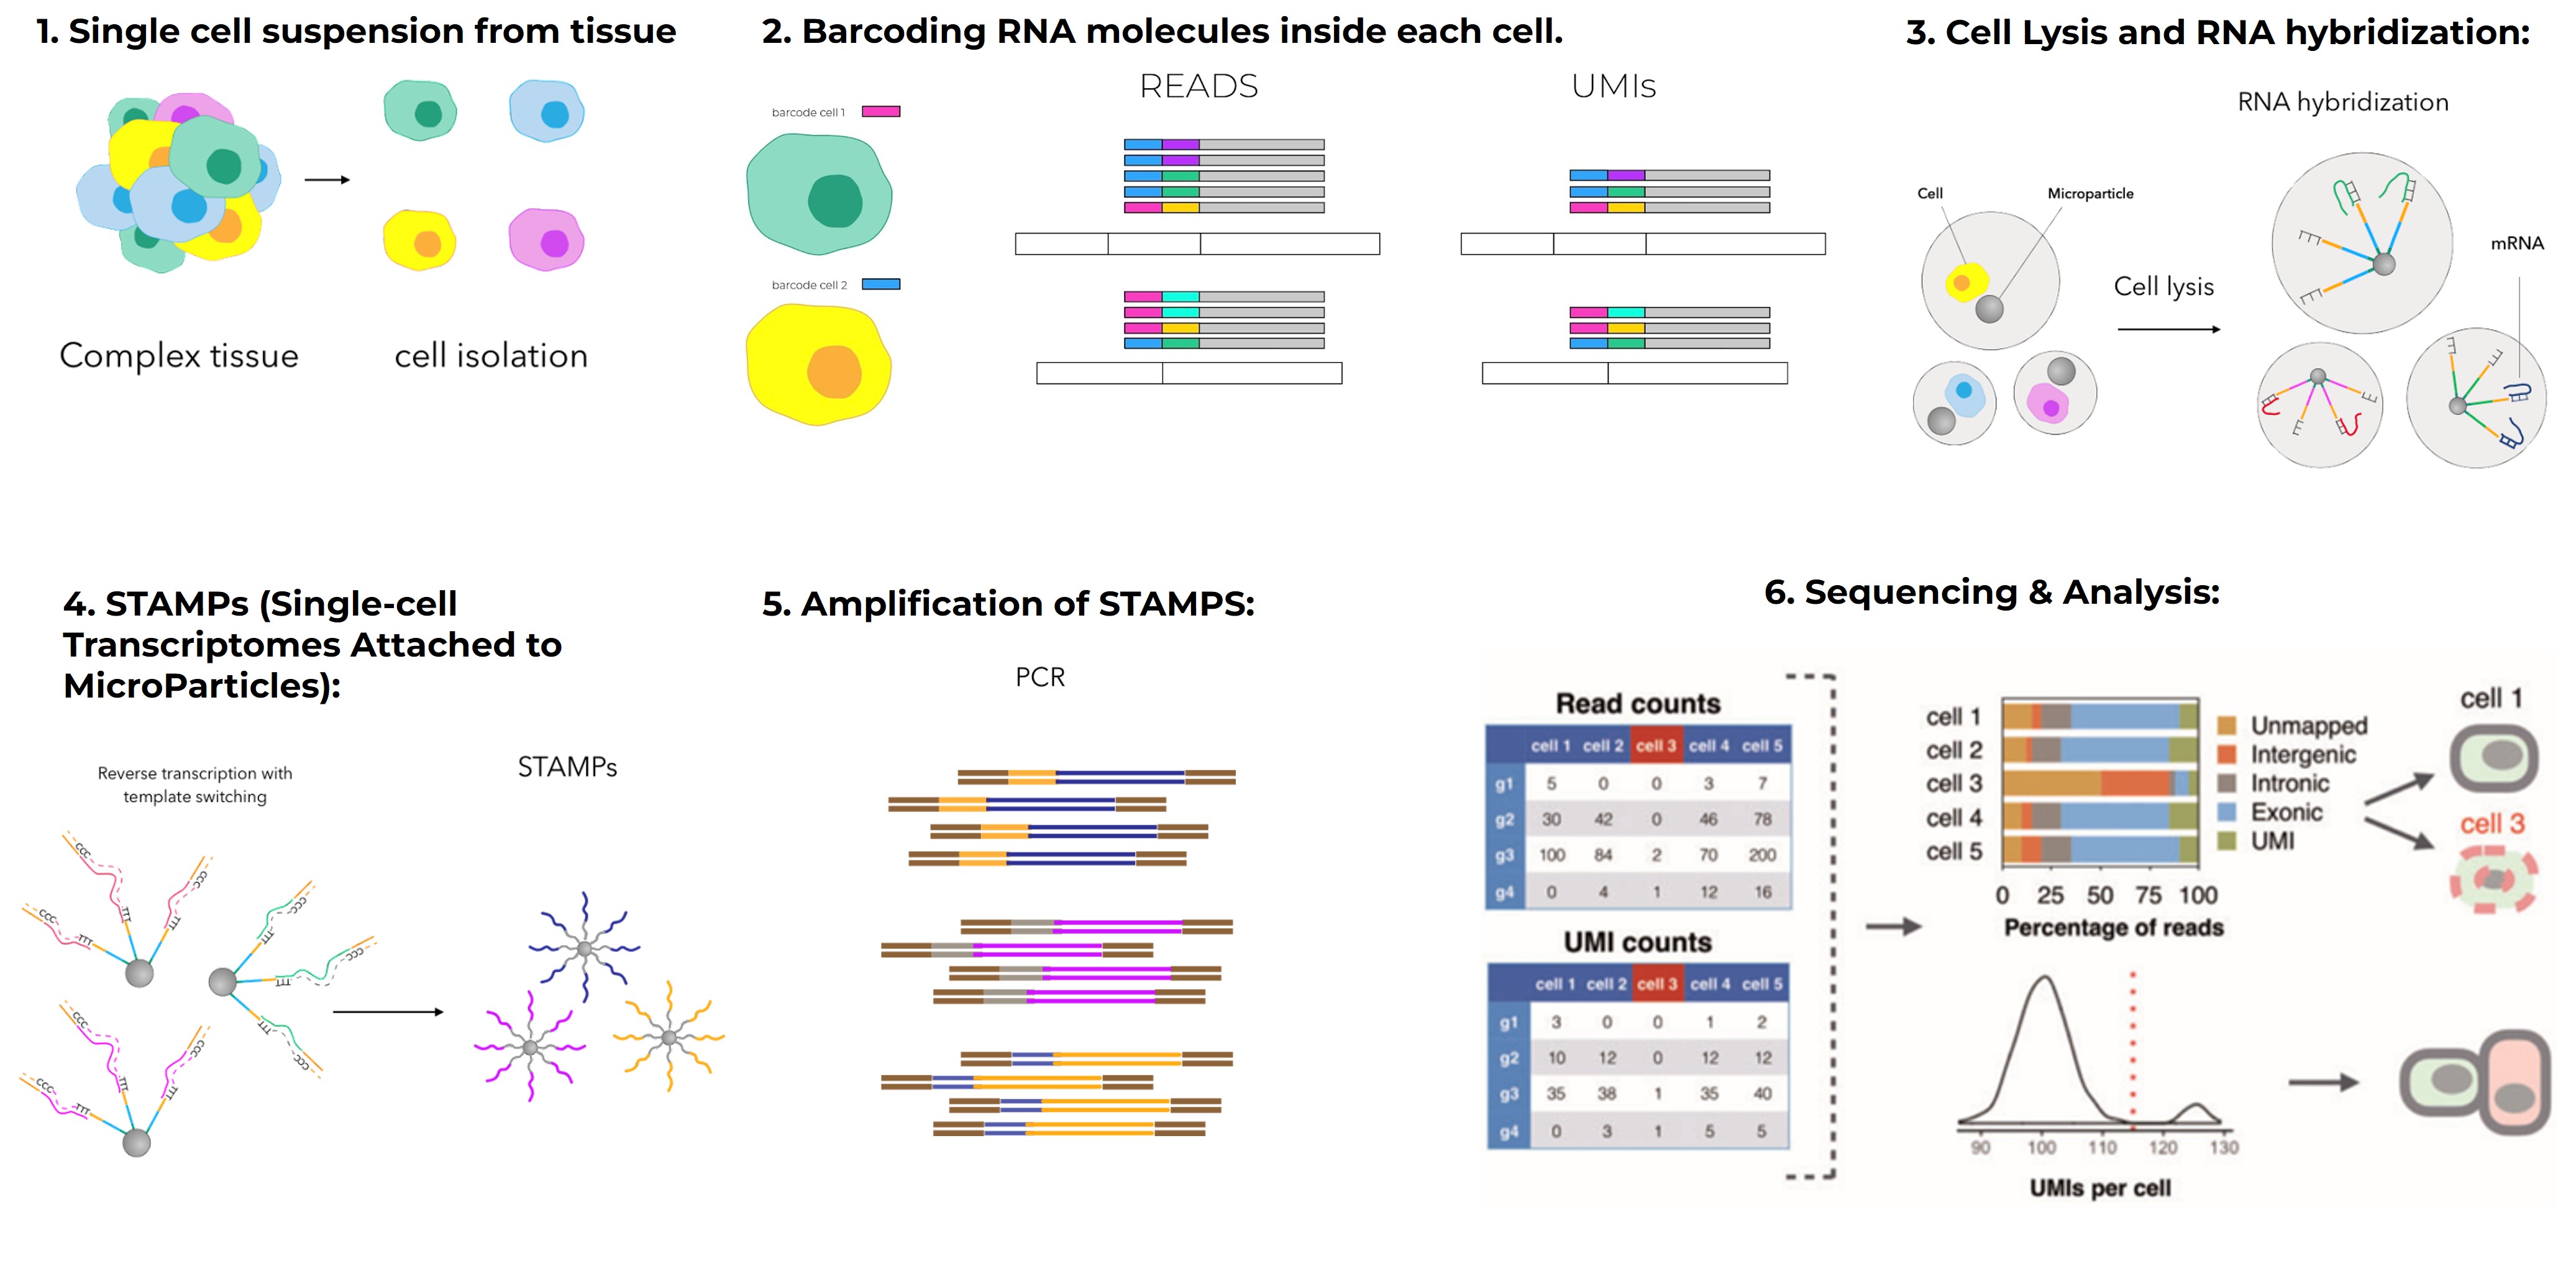
Single-cell RNA-Seq: Dissecting the Molecular Identity of Individual Cells
While bulk RNA-Seq provides an overview, it masks the complexity within cell populations. This limitation is overcome by single-cell RNA sequencing (scRNA-Seq), a technique that measures gene expression in individual cells. It enables scientists to identify rare cell types, reveal cellular heterogeneity, and construct developmental or differentiation trajectories that would be impossible to discern from bulk data.
scRNA-Seq typically relies on microfluidics platforms like 10x Genomics, which encapsulate individual cells into droplets, followed by barcoding and sequencing. The method has transformed our understanding of tissues composed of diverse cell types. A landmark example is the study by Zheng et al. in 2017, where researchers profiled over 68,000 peripheral blood mononuclear cells (PBMCs), unveiling a high-resolution map of immune cell diversity. This work, published in Nature Communications, became foundational in immunology and is frequently referenced in cancer and infectious disease research (https://doi.org/10.1038/ncomms14049).
Spatial Transcriptomics: Mapping Gene Expression in Its Native Context
Understanding which genes are expressed is one thing -but knowing where they are expressed within a tissue is an entirely new layer of biological insight. Spatial transcriptomics bridges the gap between histology and transcriptomics by localizing gene expression directly within intact tissue sections. This approach involves placing tissue slices on barcoded glass slides that capture mRNA in a spatially resolved manner. After sequencing, gene expression data can be mapped back to their original tissue locations, creating a spatial atlas of transcriptomic activity.
Spatial transcriptomics is especially valuable in complex tissues where organization matters, such as in the brain, tumors, or developing embryos. For example, Ståhl et al. (2016) used this technology to map gene expression in mouse brain sections, revealing how different regions of the brain have distinct molecular signatures—information that would be lost using bulk or even single-cell methods (Science, https://doi.org/10.1126/science.aaf2403). This method has since been applied to tumor invasion studies, neurodevelopmental research, and plant developmental biology, providing a new lens to examine tissue architecture and function.
Time-Series Transcriptomics: Tracking Gene Expression Across Time
Biological systems are dynamic, and gene expression often changes over time in response to internal programs or external stimuli. Time-series transcriptomics is designed to capture these changes by sampling RNA at multiple time points. This longitudinal approach is essential for studying developmental processes, drug responses, and circadian rhythms.
In circadian biology, for instance, researchers use time-series RNA-Seq to uncover oscillating patterns of gene expression that align with the 24-hour day-night cycle, shedding light on sleep disorders and metabolic diseases. In developmental studies, it helps chart the progression from stem cells to specialized cells by revealing which genes are activated or silenced at each stage. Time-series data require specialized statistical models to account for temporal correlations but offer profound insights into biological processes that unfold gradually rather than instantaneously.
Metatranscriptomics: Exploring Gene Expression in Microbial Ecosystems
When the subject of study shifts from individual organisms to entire microbial communities, metatranscriptomics becomes the method of choice. This approach analyzes RNA transcripts from mixed microbial populations, such as those found in soil, oceans, or the human gut, to understand what functions are being actively carried out by the community.
Unlike metagenomics, which tells us what microbial genes are present, metatranscriptomics reveals which genes are currently active, offering a snapshot of functional activity. In environmental research, this can help monitor ecosystem health or pollutant degradation. In human health, metatranscriptomics is used to study the gut microbiome’s role in digestion, immunity, and disease. For example, transcriptomic profiling of gut microbes has uncovered shifts in metabolic pathways during inflammatory bowel disease or obesity, suggesting microbial signatures that correlate with health or disease states.
Key Techniques and Tools
| Step | What Happens | Common Tools Used | Bulk RNA-Seq | Single-cell RNA-Seq | Spatial Transcriptomics | Time-Series RNA-Seq | Metatranscriptomics |
| RNA Extraction | Isolation of total RNA from cells, tissues, or microbial communities. This is the foundation of any transcriptomic study. | TRIzol, Qiagen Kits | Microbial RNA enrichment, rRNA depletion | ||||
| Library Preparation | Conversion of RNA into cDNA, fragmentation, addition of adapters and barcodes. Essential for sequencing. | Illumina TruSeq, NEBNext | Barcoding with 10x Genomics, SMART-Seq2 | Visium Spatial Gene Expression Kit | Illumina TruSeq, NEBNext | MetaPrep Kits, NEBNext | |
| Sequencing | High-throughput reading of cDNA to generate raw sequence data. Platform depends on read length and depth needed. | Illumina, PacBio, Oxford Nanopore | Illumina, 10x Genomics Chromium | Illumina (short-read), 10x Visium | Illumina, PacBio, Oxford Nanopore | Illumina, ONT for long-read meta-RNA-Seq | |
| Quality Control | Checking data quality for contamination, base quality, adapter presence, and overall read metrics. | FastQC, MultiQC | |||||
| Alignment & Quantification | Mapping reads to a reference genome or transcriptome, and quantifying gene or transcript abundance. | STAR, HISAT2, Kallisto, Salmon | CellRanger (10x), STARsolo, Kallisto | bustools | Space Ranger, STAR | STAR, HISAT2, Kallisto, Salmon | |
| Downstream Analysis(Statistical analysis of expression data, clustering, trajectory modeling, pathway enrichment) | Identifying differentially expressed genes, clustering cells or conditions, and interpreting biological significance. | DESeq2, EdgeR, Seurat, Monocle, IPA | DESeq2, EdgeR, IPA(for DEG and pathway mapping) | Seurat, Monocle, SCDE(for clustering and trajectories) | Loupe Browser, Seurat Spatial Module | ImpulseDE2, maSigPro, DESeq2 (time-aware) | HUMAnN2, MetaTrans, SAMSA2 |
| Visualization(Plotting, dimensionality reduction, genome mapping) | Visualizing gene expression patterns, heatmaps, clusters, PCA, UMAP, and spatial maps. | ggplot2, ComplexHeatmap, UCSC Genome Browser | ggplot2, ComplexHeatmap, UCSC Genome Browser(for DEGs and gene mapping) | Seurat’s DimPlot, UMAP/t-SNE, ggplot2 | SpatialFeaturePlot, Loupe Browser | ggplot2, ComplexHeatmap, UCSC Browser | Krona plots, MetaPhlAn, ggplot2 |
If you're a student stepping into bioinformatics, biomedical sciences, or molecular biology - start by mastering bulk RNA-Seq, then dive into single-cell and spatial methods as you grow. Work on public datasets, run pipelines, and visualize your results.
You can begin with the transcriptomics course series on the LBRN Training platform which will help you understand about different sequencing techniques and methodologies and the steps involved in transcriptomic data analysis from dataset extraction > data preparation > dimensionality reduction > differential gene expression analysis > Functional Characterisation, you will get to learn the basics of each step involved and then learn how to run the analysis using R. Once you have a good understanding of the transcriptomic data analysis then shift your gears to single cell transcriptomic data analysis on the LBRN Training platform which will help you understand how to identify the differentially expressed genes in different cell clusters and identify the pathways targeted.
Link to the courses
Transcriptomic Data Analysis: https://lbrntraining.com/categories/transcriptomics/transcriptomic-data-analysis
Single Cell Transcriptomic Data Analysis:
https://lbrntraining.com/categories/transcriptomics/single-cell-transcriptomics