
In traditional biology, we study genes, proteins, and pathways by examining large groups of cells-extracting average behaviors from whole tissues. But what if one cell behaves differently from its neighbor? What if a small population of cells holds the key to understanding cancer, development, or immune response? These questions led to one of the most transformative innovations in modern biology: single-cell RNA sequencing (scRNA-seq).
With single-cell analysis, we no longer see a “blurry” average of gene expression-we see each cell’s unique voice. This article will walk you through what single-cell RNA-seq is, why it matters, how the data is analyzed, and what insights you can extract. Whether you're a student, a new researcher, or a biologist transitioning into bioinformatics, this guide is designed to get you started confidently and clearly.
What is Single-Cell RNA Sequencing (scRNA-seq)?
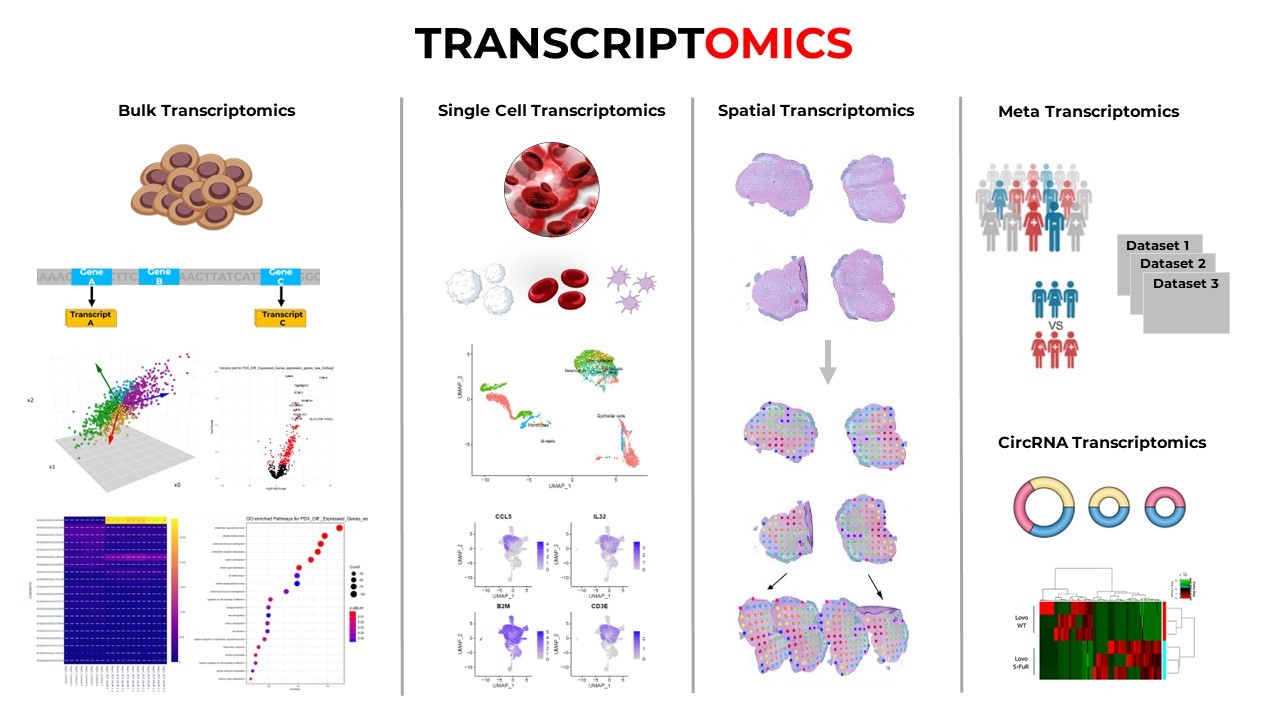
Single-cell RNA sequencing is a method to profile gene expression at the level of individual cells. It tells us which genes are turned “on” or “off” in each cell, allowing us to capture the diversity of cell types, states, and behaviors within a sample. This has revolutionized our understanding of complex tissues, tumors, immune responses, and development.
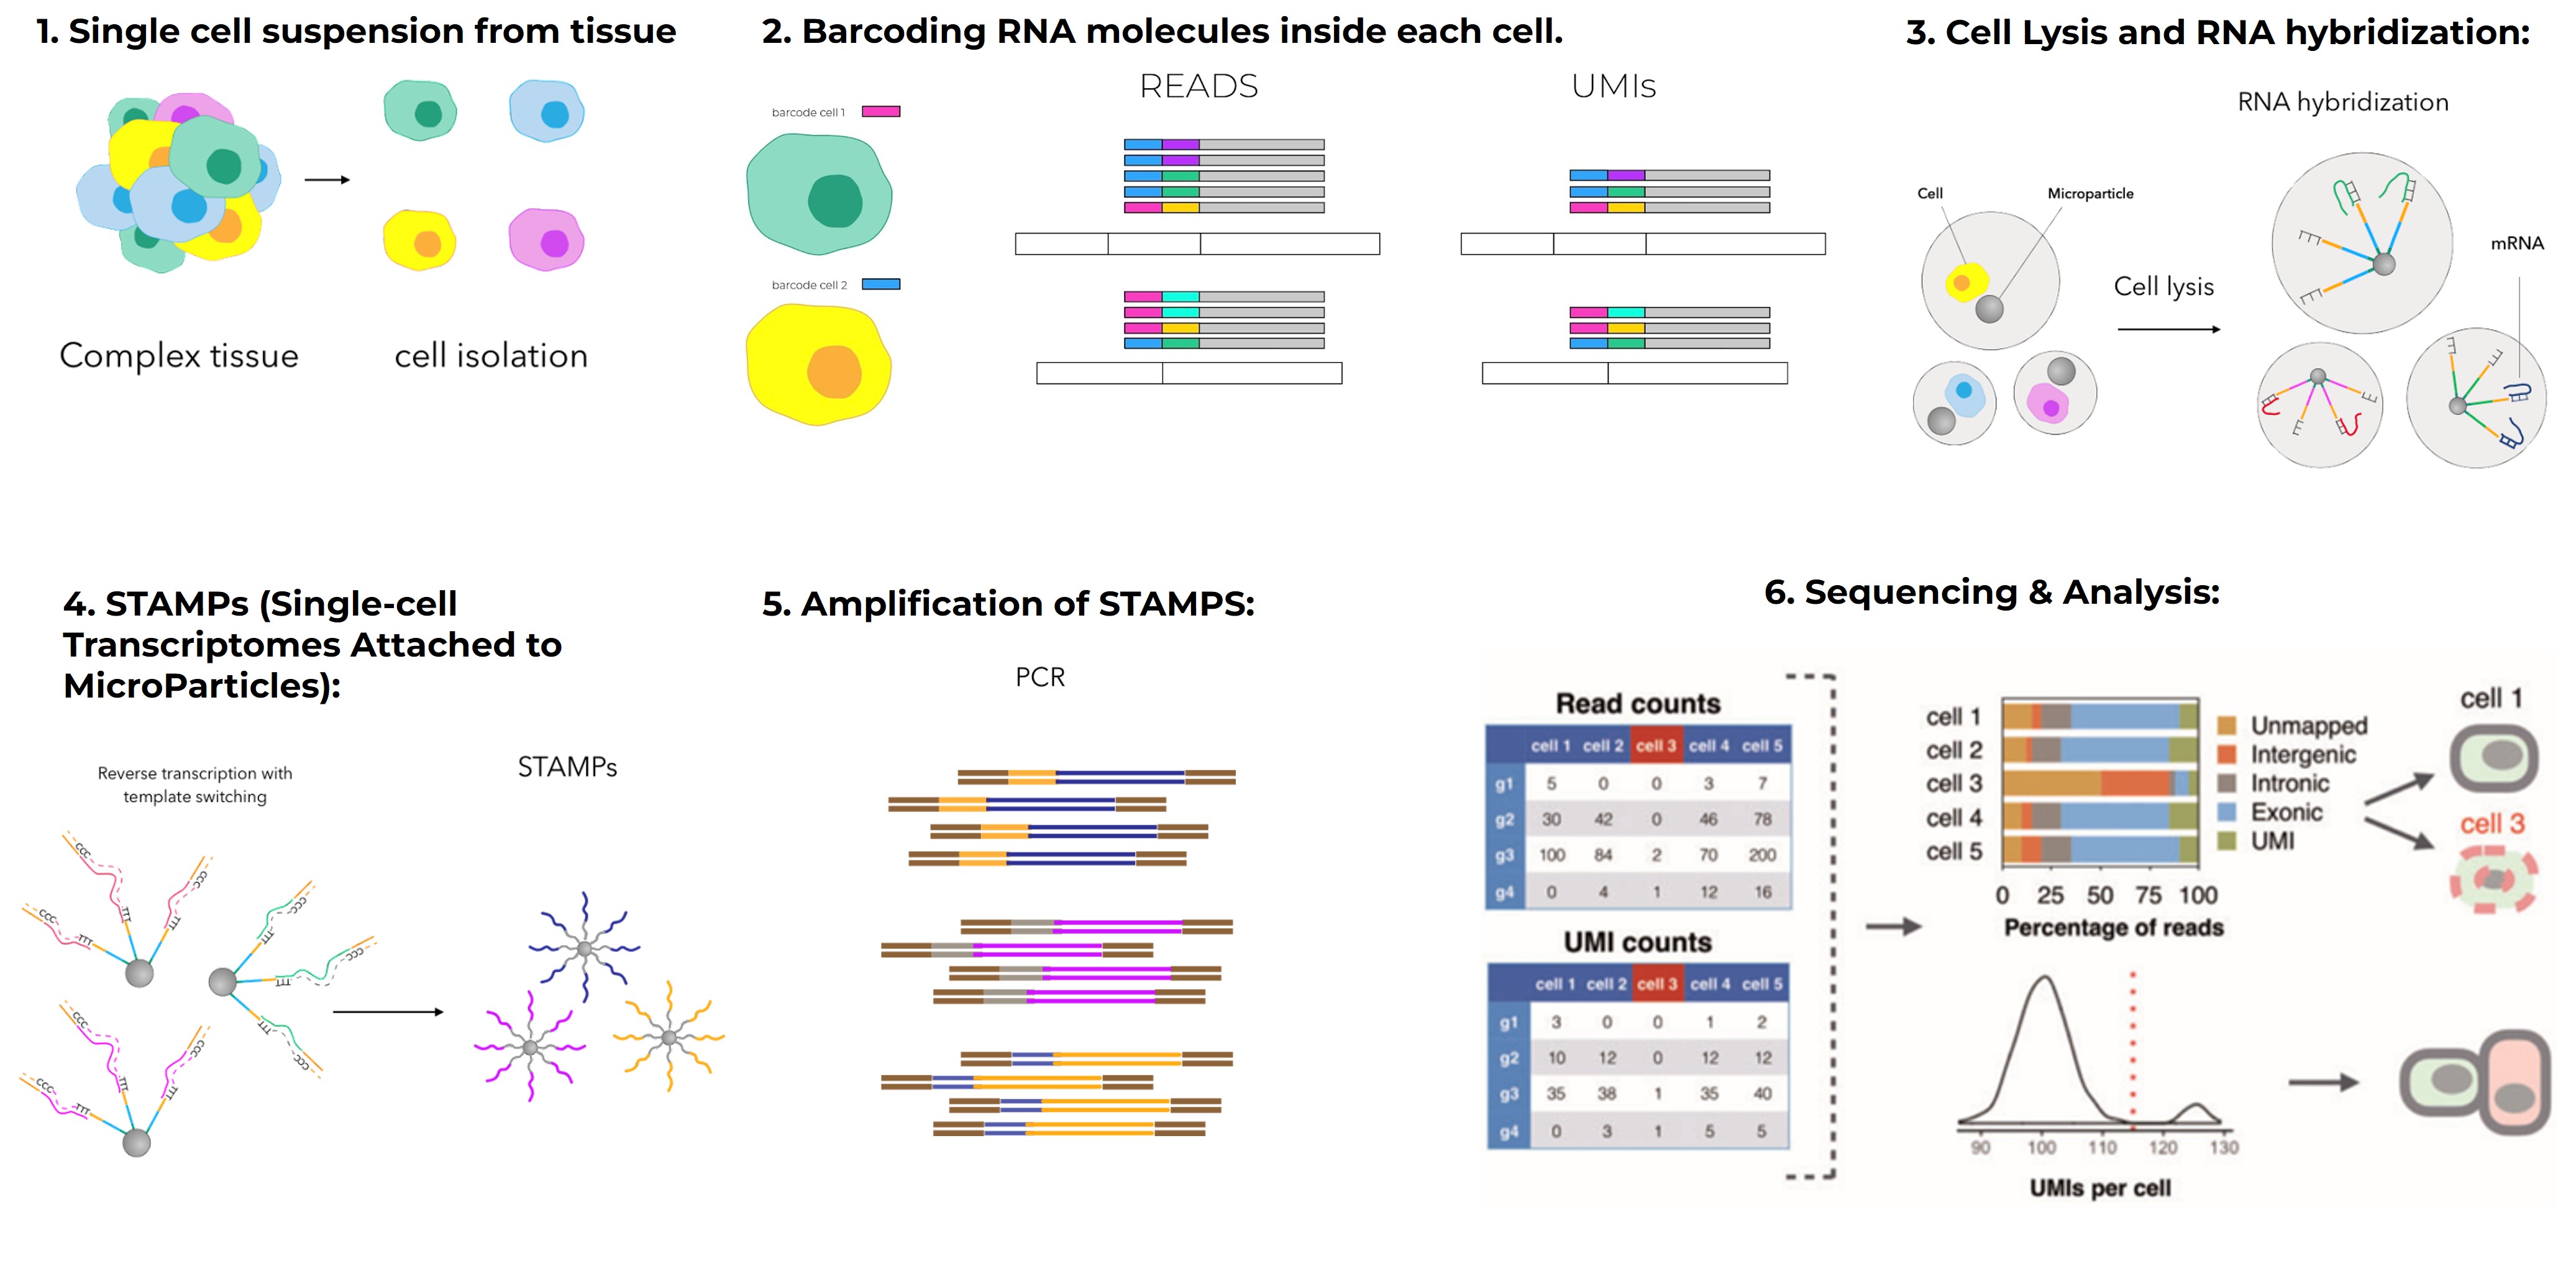
In a typical scRNA-seq experiment, tissues are dissociated into individual cells, RNA is captured from each cell, converted to cDNA, and sequenced. The result is a gene-by-cell matrix: each row is a gene, each column is a cell, and each value represents expression level.
But the real power lies in analyzing this matrix-finding patterns, identifying cell types, and extracting biological meaning.
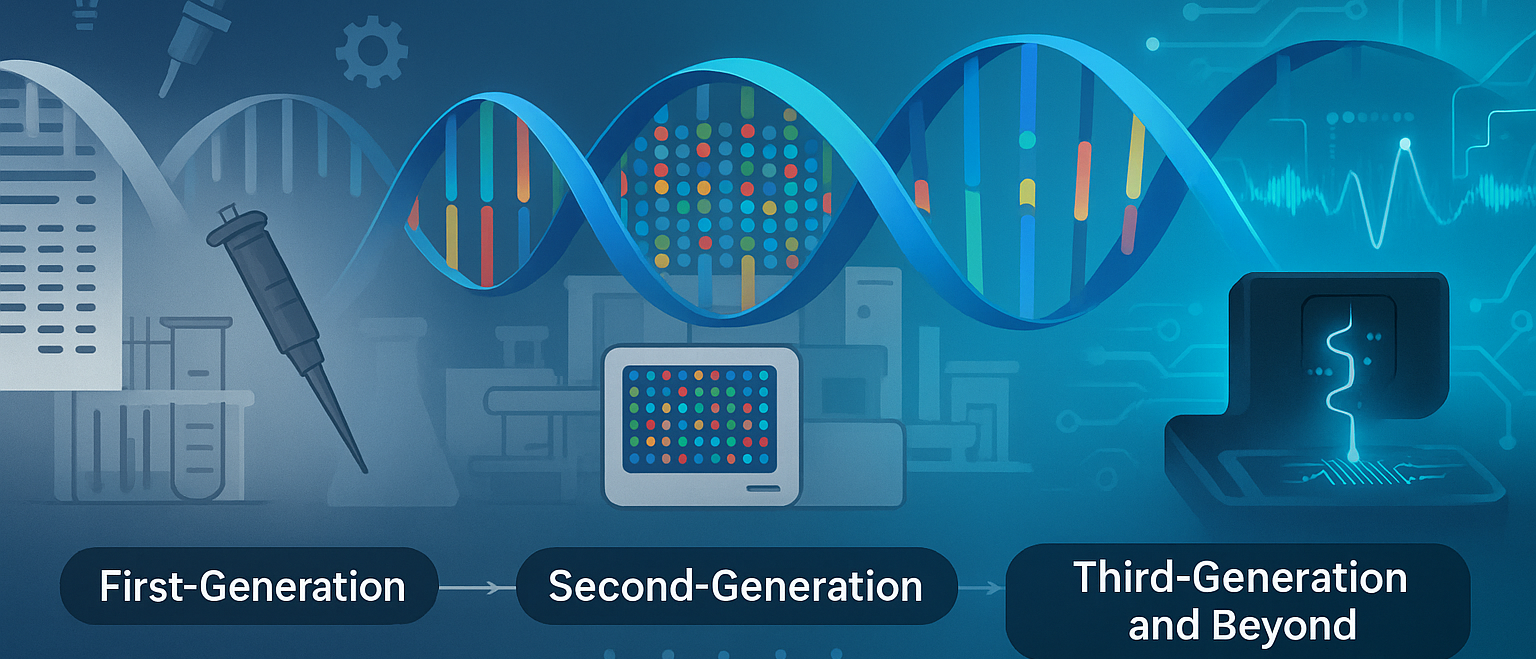
A Brief Timeline: Key Milestones in Single-Cell Biology
| Year | Milestone |
|---|---|
| 2009 | First single-cell transcriptome published (Tang et al., Nat Methods) |
| 2015 | Launch of 10x Genomics Chromium system enables scalable scRNA-seq |
| 2017 | Seurat v2 brings integrated clustering, marker identification, and visualization |
| 2020s | Rise of multimodal single-cell approaches (e.g., CITE-seq, spatial RNA-seq, scATAC-seq) |
These breakthroughs have made single-cell analysis faster, cheaper, and more insightful than ever before.
The Full Pipeline: Steps Involved in Single-Cell Data Analysis
Let’s walk through a beginner-friendly roadmap-from raw data to biological interpretation.
1. Preprocessing and Quality Control
You start with raw FASTQ files from your sequencer. These are processed using tools like Cell Ranger (10x Genomics), STARsolo, or Kallisto | bustools to align reads and generate a gene-by-cell count matrix.
Then comes quality control (QC):
-
Filter out cells with too few or too many genes.
-
Remove cells with high mitochondrial gene content (which may indicate cell death).
-
Detect and remove doublets (two cells sequenced as one).
QC is critical-it ensures you’re analyzing only high-quality, biologically meaningful cells.
2. Normalization and Feature Selection
Each cell captures a different number of RNA molecules, so raw counts must be normalized. A popular method is log normalization, which scales counts per cell to a fixed total and log-transforms the result.
Next, you select highly variable genes (HVGs)-those that show meaningful variation across cells. These genes are the most informative for clustering and visualization.
3. Dimensionality Reduction
With 10,000+ genes per cell, we need to simplify the data. Principal Component Analysis (PCA) reduces the data to major axes of variation. Then, we use UMAP or t-SNE to visualize cells in 2D space. Cells with similar expression profiles appear closer together.
This step reveals structure in your dataset-groups, gradients, outliers-at a glance.
4. Clustering and Cell Type Annotation
Now, we identify clusters of similar cells using graph-based methods (e.g., Louvain or Leiden algorithms). Each cluster ideally represents a cell type or subpopulation.
To name these clusters, we look at marker genes-genes highly expressed in a given cluster. For example:
-
CD3E → T cells
-
EPCAM → Epithelial cells
-
CD14 → Monocytes
You can use reference datasets or tools like SingleR, CellTypist, or Azimuth to assist with annotation.
5. Differential Expression and Marker Discovery
This step helps you understand what makes one cluster different from another. You can compare gene expression between clusters or between conditions (e.g., disease vs healthy). It helps identify:
-
Marker genes defining a cell type
-
Regulatory genes driving transitions
-
Disease-specific expression signatures
Tools like Seurat, DESeq2, or edgeR are used here.
6. Trajectory and Pseudotime Analysis
When you want to study a biological process-like stem cell differentiation or immune cell activation-you can use trajectory inference. This reconstructs how cells move through states over “pseudotime”.
Popular tools include Monocle3, Slingshot, and Palantir. These tools model developmental progressions without actual time-course experiments.
Example: Using Monocle, researchers traced how hematopoietic stem cells give rise to multiple blood cell types in a continuous developmental path.
7. Integration, Batch Correction, and Multi-Modal Analysis
When you analyze data from multiple samples (e.g., patients, time points, labs), batch effects must be corrected. Tools like Harmony, Seurat v4, and Scanorama help integrate datasets while preserving biological signals.
Advanced studies now integrate RNA expression with:
-
Surface proteins (CITE-seq)
-
Chromatin accessibility (scATAC-seq)
-
Spatial location (spatial transcriptomics)
This provides a multi-dimensional view of cells: their identity, state, and context.
What Can You Learn from Single-Cell Analysis?
Single-cell analysis unlocks insights that bulk methods simply cannot reveal. For example:
-
In cancer research, scRNA-seq uncovered therapy-resistant subpopulations that survive treatment.
-
In immunology, it revealed the diversity of T cell states during infection and vaccination.
-
In neuroscience, it mapped all cell types in the mouse brain, revealing new neuronal subtypes.
You can study:
-
Rare cell types (e.g., circulating tumor cells)
-
Cellular transitions (e.g., EMT in metastasis)
-
Gene regulatory networks
-
Intercellular communication (e.g., ligand-receptor analysis)
How to Get Started: Tools, Data, and Learning Resources
You don’t need to be a coding expert to begin. Start with:
-
Seurat tutorials: https://satijalab.org/seurat/
-
Scanpy (Python-based): https://scanpy.readthedocs.io
-
LBRN Training Platform: Learn single-cell analysis step-by-step with R workflows and real datasets
-
Public Datasets: Try data from Human Cell Atlas, Single Cell Expression Atlas, or GEO
Make sure to practice using tools like Cell Ranger, Seurat, and Monocle, and explore how different preprocessing decisions affect your results.
Conclusion: Why Single-Cell Analysis Is the Future
Single-cell data analysis is more than a technique-it’s a way of thinking about biology at its most fundamental level. By studying cells as individuals rather than averages, we gain clearer insights into disease, development, and life itself.
For students entering bioinformatics, mastering single-cell analysis opens doors to impactful research and innovation. With accessible tools, growing community support, and open datasets, there has never been a better time to dive in.
The data is waiting. All you need is the curiosity to explore, one cell at a time.